In 2019 Oil & Gas and Mining industry spent more than $2.8 B in training Geosciences and Engineering staff worldwide. However, there is little to no information on the impact of this training investment. Part of the reason of having no insight is the fact that aside from all technological advancements in our industry, corporates still run 70% of their training using traditional methods (classrooms) or isolated online courses. Application of these training methods hinder recording any data on the staff’s engagement during training and the effect on their competency after taking the training and over time. Thus, making measurement of the return on training investment very difficult for the corporates.
As a corporate, you can train your staff all you want, but if there is no insight on how the training is working, i.e., if it is helping your corporate reach a business goal, then you may be just wasting time and money. This is in addition to the millions of dollars wasted in exploration and production projects due to poor decisions made by staff who lack required knowledge in the domain.
“Back in winter 2019, I had a series of conversations with multiple traditional training instructors (some very well known with lineups for their classes in the O&G) and one thing that came out of every single conversation was the fact that “corporates are primarily after checking off the staff’s training checkboxes and not really focused on measuring the applicability, sustainability, and long-term effects of training.”
Ellie Ardakani, CEO & Cofounder
But what if it didn’t have to be that way? What if, with a true adoption of digital technology, we could collect, analyze, and understand training data to help corporates to get value out of their training expenditure?
Training data collection on digital platforms can help tremendously to get a better feel of business impact in addition to boosting staff’s performance. You can use training data from digital platforms such as metaKinetic along with project KPIs to create a compelling visual display of the positive effects of your training investment. And as you know, a picture is worth a thousand words.
Here is a quick example of how to do just that using the metaKinetic platform:
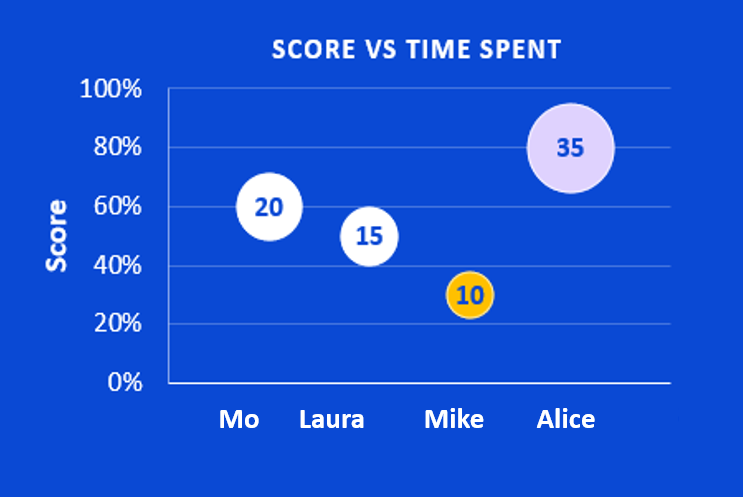
This plot shows the training data recorded by metaKinetic from 4 staff members in a G&G department of an E&P company. All 4 staff are geoscientists with less than 5 years experience and are about to start working on a seismic acquisition project. The plot shows the assessment score for each team member after taking a “seismic acquisition” training simulation. The bubble’s size indicates the duration that each staff member spent in using the associated simulation with the assessment.
According to this data Alice with 80% score spent more time (35 minutes) during the training to engage and explore different scenarios with the simulation and therefore developed a better understanding of the underlying scientific concept before taking the assessment. Mike on the other hand, with spending the least amount of time on the simulation had the minimum score of 30%. Here, based on the level of engagement and the assessment score, we can conclude who within the team needs more encouragement and training to be able to perform as competent as the other team members. This was a quick example on how training data can provide insight for technical managers on their team competency and performance. In addition, metaKinetic Peer-Benchmark creates a safe and encouraging environment for staff to compare their competency with their peers.
Peer-Benchmark on metaKinetic is designed to compare staff’s competency against one another to give them a sense of where they need additional training and practice.
See it for yourself 👇